Quick Answer: Bitcoin market indicators are data points that help investors read market conditions, including ETF flows, spot liquidity, funding rates, open interest, liquidations, options activity, stable coin liquidity, on-chain holder behavior, and macro events. They can show pressure, participation, leverage, and sentiment, but they cannot reliably predict Bitcoin’s next price move. The best approach is to combine several signals, label uncertainty clearly, and avoid treating one dashboard as a guaranteed buy or sell signal.
Bitcoin trades 24/7, reacts to global liquidity, and now sits between two worlds: crypto-native markets and regulated financial products such as spot Bitcoin ETFs and CME futures. That makes market analysis more useful—but also more confusing. A beginner might see ETF outflows, positive funding, rising open interest, and a bullish on-chain chart on the same day and not know which one matters most.
This guide explains nine bitcoin market indicators, what each one may mean, what it does not prove, and how to combine conflicting signals without turning market context into a price prediction.
What Are Bitcoin Market Indicators?
Bitcoin market indicators are measurements that help explain supply, demand, leverage, liquidity, volatility, and investor behavior.
They are not magic signals. They are clues.
A good Bitcoin indicator can help answer questions such as:
- Are spot buyers active or passive?
- Are ETF investors adding or removing exposure?
- Are leveraged traders crowded on one side?
- Is Bitcoin open interest rising too quickly?
- Are liquidations forcing price moves?
- Are options traders paying more for upside or downside protection?
- Are stable coins entering or leaving crypto markets?
- Are short-term holders under stress?
- Are macro events increasing risk appetite or risk aversion?
The most important rule: one signal is context, not confirmation. A useful market view usually requires several signals pointing in the same direction.
If you are still learning the asset itself, start with how Bitcoin works before using indicators to interpret market structure.
Bitcoin ETF Flows
Bitcoin ETF flows show whether money is moving into or out of spot Bitcoin exchange-traded funds. Since U.S. spot Bitcoin ETFs created a regulated access point for many institutions and brokerage investors, ETF flows have become one of the most watched Bitcoin demand indicators.
Positive flows mean ETF shares are seeing net buying demand. Negative flows mean funds are seeing net redemptions. But the interpretation is not always simple.
Large ETF inflows can show institutional demand, advisor allocation, or retail brokerage demand. Large outflows can show profit-taking, risk reduction, tax positioning, portfolio rebalancing, or a temporary rotation into cash.
What it may mean
ETF inflows may suggest that regulated-market buyers are adding Bitcoin exposure. If inflows continue for several days or weeks, they can support spot demand and improve market confidence.
ETF outflows may suggest reduced appetite, portfolio de-risking, or weaker institutional participation. Outflows can matter more when they appear alongside falling spot volume, weak price action, and cautious derivatives positioning.
What it does not prove
ETF inflows do not guarantee Bitcoin will rise. ETF outflows do not guarantee Bitcoin will fall. Flows can lag price, reverse quickly, or reflect one large participant rather than broad market conviction.
ETF flows should be compared with:
- Bitcoin price reaction
- Spot trading volume
- Fund premium or discount
- Broader risk-asset sentiment
- Futures positioning
- On-chain exchange balances
- Macro calendar risk
For investors comparing ETFs with traditional fund structures, this ETF vs mutual fund guide explains how ETF mechanics differ from mutual funds.
Spot Volume and Order-Book Liquidity
Spot volume shows how much Bitcoin is trading on exchanges. Order-book liquidity shows how much buy and sell interest is available near the current price.
Together, they help answer a basic question: Is the market move supported by real spot participation, or is it happening in thin conditions?
A price rally with strong spot volume and deep order books usually has more confirmation than a rally on weak volume and shallow liquidity. A price drop with rising volume can show stronger selling pressure than a low-volume drift lower.
What it may mean
Rising spot volume can indicate stronger participation from real buyers and sellers. Strong order-book liquidity can reduce slippage and make price moves less fragile.
Weak volume and thin liquidity can make Bitcoin more vulnerable to sharp moves, liquidation cascades, and false breakouts.
What it does not prove
High spot volume is not automatically bullish. It can occur during panic selling. Low spot volume is not automatically bearish. It can happen during quiet consolidation.
Liquidity matters because price can move sharply when there are not enough resting orders to absorb aggressive buying or selling.
Useful spot and liquidity checks include:
- Spot trading volume
- Exchange order-book depth
- Bid-ask spread
- Slippage estimates
- Spot cumulative volume delta
- Exchange inflow and outflow behavior
- Weekend versus weekday liquidity
Funding Rates
Funding rates apply to perpetual futures contracts. They are periodic payments exchanged between long and short traders to keep perpetual futures prices close to spot prices.
When funding is positive, long traders generally pay short traders. When funding is negative, short traders generally pay long traders.
That makes crypto funding rates a useful sentiment and leverage indicator.
What it may mean
Positive funding can suggest traders are leaning long. Mildly positive funding during an uptrend can be normal. Extremely positive funding can warn that bullish leverage is crowded.
Negative funding can suggest traders are leaning short. Mild negative funding during a selloff can be normal. Deeply negative funding can sometimes create short-squeeze risk if price starts rising.
What it does not prove
Negative funding is not automatically bullish. It can remain negative while price keeps falling. Positive funding is not automatically bearish. It can stay positive during strong bull trends.
Funding needs to be read with:
- Price trend
- Open interest
- Liquidations
- Spot demand
- Options skew
- Exchange-specific differences
- Timeframe
A common beginner mistake is treating negative funding as a guaranteed “buy” signal. It is better to say: negative funding may show crowded shorts, but confirmation requires price strength, spot demand, and no immediate liquidity breakdown.
Open Interest
Open interest is the total amount of outstanding futures or options contracts that have not been closed or settled. In Bitcoin markets, traders watch Bitcoin open interest closely because it helps measure leverage and participation.
Rising open interest means more contracts are open. Falling open interest means positions are being closed, liquidated, or reduced.
What it may mean
Rising open interest with rising price can show new participation entering the market. That can be constructive if spot demand also confirms.
Rising open interest with flat or falling price can be more dangerous. It may mean leverage is building without strong spot support.
Falling open interest after a sharp move can suggest deleveraging. That may reduce liquidation risk, but it can also show traders leaving the market.
What it does not prove
Rising open interest is not always bullish. It does not tell you whether new positions are long or short without additional data. It also does not prove that institutional demand is rising unless you know where the open interest is building.
Open interest should be compared across:
- Perpetual futures exchanges
- CME futures
- Options markets
- Funding rates
- Liquidation maps
- Price trend
- Spot volume
Regulated futures activity, especially on CME, may tell a different story from offshore perpetual futures. That is why open interest is most useful when separated by venue and contract type.
Liquidations
Liquidations happen when leveraged positions are forcibly closed because a trader no longer has enough margin to keep the position open.
Long liquidations occur when leveraged bullish traders are forced out during price declines. Short liquidations occur when leveraged bearish traders are forced out during price rallies.
Liquidations can accelerate moves because forced selling or buying adds pressure to the market.
What it may mean
Large long liquidations can show that bullish leverage was crowded and has been flushed out. After a major liquidation event, selling pressure may cool if weak long positions have already been removed.
Large short liquidations can show that bearish leverage was crowded and has been squeezed. This can produce sharp upside moves, especially in thin liquidity.
What it does not prove
Liquidations do not always mark a bottom or top. A long-liquidation flush can be followed by more selling if spot demand remains weak. A short squeeze can fade if real buyers do not continue after forced buying ends.
Liquidation data is most useful when combined with:
- Funding rates
- Open interest change
- Price reaction
- Spot volume
- Order-book depth
- Support and resistance zones
- Macro news timing
A liquidation spike tells you forced activity happened. It does not tell you whether durable demand or supply has changed.
Options Volatility and Skew
Options markets show how traders price future volatility and directional risk.
Two useful options indicators are implied volatility and skew.
Implied volatility shows how much future price movement options traders are pricing in. Skew shows whether traders are paying more for downside protection or upside exposure.
What it may mean
Rising implied volatility can suggest traders expect bigger moves. This often happens before major macro events, regulatory decisions, ETF developments, or large technical breaks.
Defensive skew means traders are paying more for downside protection. That may reflect fear, hedging demand, or institutional risk management.
Call-heavy skew may suggest demand for upside exposure, but it can also reflect speculative positioning.
What it does not prove
High implied volatility does not predict direction. It only suggests larger expected movement. Defensive skew does not guarantee a crash, and bullish call demand does not guarantee a breakout.
Options data should be read with:
- ETF flow trends
- Spot participation
- Futures leverage
- Macro calendar
- Major expiry dates
- Dealer positioning
- Price distance from key strike levels
Cboe Bitcoin ETF options and CME crypto derivatives can help show how regulated-market participants are pricing volatility, but crypto-native options venues may show a different risk appetite.
Stable coin Liquidity
Stable coins are a major source of crypto-market liquidity because traders use them as cash-like assets for buying, selling, collateral, and DeFi activity.
Stable coin liquidity can show whether deployable crypto cash is expanding or contracting. This is one of the most practical crypto liquidity indicators because stable coins often sit at the center of exchange balances, DeFi lending, perpetual futures collateral, and cross-chain transfers.
What it may mean
Expanding stable coin supply or rising exchange stable coin balances may suggest more potential buying power in crypto markets. That can be constructive if it later moves into Bitcoin.
Falling stable coin liquidity can suggest capital is leaving crypto markets, moving back to banks, or sitting outside exchange venues.
Stable coin flows can also show whether traders are preparing to take risk or reducing exposure before macro events.
What it does not prove
Stable coin growth does not guarantee Bitcoin buying. Stable coins can remain idle, move into altcoins, support market making, or sit in DeFi strategies.
Stable coin outflows do not always mean bearish pressure. They may reflect exchange migration, custody changes, regulatory shifts, or users moving between chains.
For stable coin-specific risks, review the full guide to stable coins before treating stable coins as risk-free cash.
On-Chain Cost Basis and Holder Behavior
On-chain indicators use blockchain data to estimate how different groups of Bitcoin holders are behaving.
Two common categories are short-term holder data and long-term holder data. Analysts often compare Bitcoin’s price with estimated cost-basis levels to understand whether recent buyers are in profit or loss.
What it may mean
If price is above short-term holder cost basis, recent buyers may feel less pressure. If price falls below that level, newer holders may be under stress and more likely to sell into weakness.
Long-term holder behavior can show whether experienced holders are distributing, accumulating, or staying inactive.
Realized profit and loss can help show whether the market is absorbing selling pressure or entering capitulation.
What it does not prove
On-chain data is powerful, but it is not perfect. It cannot always identify the reason coins move. Transfers may represent exchange reshuffling, custody changes, internal wallet management, or actual selling.
Cost-basis levels are not guaranteed support or resistance. Price can move through them during panic or euphoria.
Use on-chain data as market structure, not prophecy.
Useful on-chain checks include:
- Short-term holder cost basis
- Realized price
- Realized profit and loss
- Long-term holder supply
- Exchange inflows and outflows
- Dormant coin movement
- Accumulation and distribution patterns
CPI, GDP, PCE and Macro Events
Bitcoin is not only a crypto asset. It is also sensitive to liquidity, interest-rate expectations, inflation data, the dollar, risk appetite, and global macro events.
Important U.S. macro events include CPI, GDP, PCE, and Federal Reserve meetings. The Federal Reserve’s official calendar lists the July 28–29, 2026 FOMC meeting, which is why market dashboards should be checked around scheduled policy events through the Federal Reserve meeting calendar.
What it may mean
Cooler inflation data can support risk assets if investors believe the Fed has more room to ease policy or avoid tightening. Strong GDP data can support risk appetite if it suggests economic resilience, but it can also raise rate concerns if inflation remains sticky.
Hot inflation data can pressure Bitcoin if it pushes interest-rate expectations higher. A hawkish Fed surprise can reduce liquidity appetite across stocks, crypto, and speculative assets.
What it does not prove
Macro data does not move Bitcoin in a straight line. A “good” CPI report can fail to lift Bitcoin if ETF flows are weak, leverage is crowded, or liquidity is thin. A “bad” macro report can be ignored if positioning is already defensive.
Macro indicators should be combined with:
- ETF flows
- Spot volume
- Stable coin liquidity
- Funding rates
- Open interest
- Options volatility
- Dollar and Treasury yield moves
If you want a broader framework for risk-asset moves, see why the stock market is down today because many of the same macro forces can affect Bitcoin.
How to Combine Conflicting Signals

Bitcoin indicators often disagree. That is normal.
A simple way to combine them is to separate signals into four groups:
| Group | Indicators | What it helps answer |
|---|---|---|
| Demand | ETF flows, spot volume, stable coin liquidity | Are real buyers showing up? |
| Leverage | Funding rates, open interest, liquidations | Is the move supported or crowded? |
| Risk pricing | Options volatility and skew | Are traders pricing fear or upside demand? |
| Market structure | On-chain cost basis, holder behavior, macro events | Is the broader setup supportive or fragile? |
A stronger bullish setup might include:
- Sustained ETF inflows
- Rising spot volume
- Improving order-book liquidity
- Mild funding, not extreme funding
- Open interest rising slowly rather than explosively
- Limited liquidation risk
- Options skew becoming less defensive
- Price above key on-chain cost-basis levels
- Supportive macro conditions
A fragile rally might include:
- Price rising on weak spot volume
- ETF demand staying muted
- Funding becoming very positive
- Open interest rising quickly
- Thin order books
- Defensive options skew
- Price still below important holder cost-basis levels
A stronger bearish setup might include:
- ETF outflows
- Falling spot volume
- Weak stable coin liquidity
- Rising long liquidations
- Negative macro surprise
- Price below short-term holder cost basis
- Options traders paying heavily for downside protection
The key is not to label every signal bullish or bearish. The better question is: Does the signal confirm price action, or does it warn that price action is fragile?
What Market Indicators Cannot Predict
Market indicators can improve context. They cannot remove uncertainty.
Bitcoin market indicators cannot predict:
- Exact future price
- Exact top or bottom
- ETF investor behavior tomorrow
- Exchange outages
- Regulatory surprises
- Major hacks
- Forced selling by large holders
- War, sanctions, or geopolitical shocks
- Central-bank policy surprises
- Stable coin depegs
- Sudden liquidity gaps
Indicators can also become less useful when everyone watches the same chart. If too many traders position for the same signal, the market may move before the signal becomes obvious.
Use indicators to manage risk, not to create certainty.
If you invest rather than trade, a steady dollar-cost averaging strategy may be more useful than reacting to every daily signal.
Weekly Bitcoin Signal Dashboard

Dashboard timestamp: July 21, 2026
Update frequency: Weekly, and again after major CPI, PCE, GDP, FOMC, ETF-flow, or liquidation events.
Label key: Positive, Neutral, Cautious, Insufficient confirmation.
| Signal | Current direction | Plain-English meaning | Constructive interpretation | Main warning |
|---|---|---|---|---|
| Bitcoin ETF flows | Neutral | Spot ETFs returned to net inflows, but participation remained measured | Continued inflows could strengthen strategic demand | Moderate flows alone do not confirm a durable trend |
| Spot volume and order-book liquidity | Cautious | Recent recovery showed weak spot participation and thinner conviction | Price stability with improving volume would help | Thin liquidity can exaggerate rallies and selloffs |
| Funding rates | Neutral | Perpetual traders still paid a premium for long exposure, but aggressive buying cooled | Mild positive funding can coexist with a healthy trend | Faster leverage buildup could create crowding risk |
| Open interest | Insufficient confirmation | A fresh venue-by-venue reading is needed before drawing a leverage conclusion | Gradual growth with strong spot demand could confirm participation | Rising open interest without spot demand can increase liquidation risk |
| Liquidations | Insufficient confirmation | No single recent liquidation reading should define the trend | Lower forced selling could support recovery attempts | Leverage and liquidation clusters can rebuild quickly |
| Options volatility and skew | Cautious | Options markets remained defensively positioned | Less demand for downside protection would support confidence | Expiry positioning can distort short-term signals |
| Stable coin liquidity | Insufficient confirmation | Deployable crypto liquidity needs a fresh weekly supply and exchange-balance check | Rising stable coin balances may support future buying | Stable coins can sit idle or move away from Bitcoin |
| On-chain cost basis and holder behavior | Cautious | Holder resilience improved, but organic network activity remained subdued | Stronger activity and profitability could improve structure | Persistent realized losses can keep sellers active |
| CPI, GDP, PCE and macro events | Cautious | The July 28–29 FOMC meeting creates scheduled policy risk | Softer inflation and easier liquidity expectations could help | Hot inflation or hawkish Fed signals can pressure risk assets |
This dashboard is not a trading signal. It is a structured market snapshot. Update the underlying data before publishing each weekly refresh.
How Beginners Should Use This Dashboard
A beginner should not open trades based only on one row.
Use the dashboard this way:
- Start with demand: Are ETF flows, spot volume, and stable coin liquidity improving together?
- Check leverage: Are funding rates and open interest calm, or crowded?
- Check forced-risk zones: Are liquidations cooling, or is leverage rebuilding?
- Check options: Are traders paying for downside protection or upside exposure?
- Check on-chain structure: Are short-term holders in profit or under pressure?
- Check macro timing: Is CPI, PCE, GDP, or a Fed meeting about to reset the market?
If four or more signals point in the same direction, the market context may be clearer. If signals are mixed, reduce confidence.
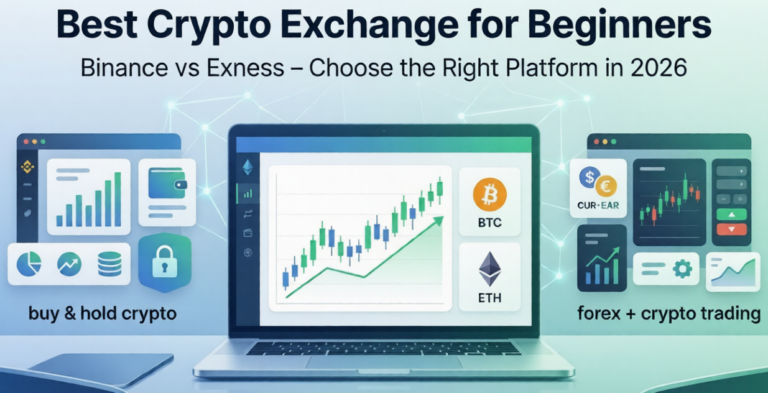
Crypto beginners should also choose platforms carefully. A market signal is not useful if your exchange has weak security, poor liquidity, or confusing fees. Review the best crypto exchanges for beginners before trading actively.
Common Mistakes
Treating ETF inflows as a guaranteed buy signal
ETF inflows can support demand, but price can still fall if leverage is crowded, macro data turns against risk assets, or spot participation weakens.
Assuming negative funding is automatically bullish
Negative funding can create short-squeeze risk, but Bitcoin can continue falling if sellers remain in control.
Ignoring open interest during rallies
A rally with fast-rising open interest and weak spot volume may be more fragile than it looks.
Reading liquidations as exact tops or bottoms
Liquidations show forced positioning, not guaranteed reversal points.
Confusing liquidity with direction
Strong liquidity can support smoother trading, but it does not tell you whether price must rise or fall.
Using on-chain data without context
Wallet movements may reflect custody changes, exchange reshuffling, or internal transfers—not always real selling.
Trading macro headlines without a plan
CPI, GDP, PCE, and Fed events can move markets quickly, but the first reaction is not always the final direction.
Quick Summary
- Bitcoin market indicators help explain demand, liquidity, leverage, volatility, and holder behavior.
- Bitcoin ETF flows are useful, but they do not guarantee price direction.
- Spot volume and order-book liquidity help confirm whether a move has real participation.
- Crypto funding rates show leverage bias, but negative funding is not automatically bullish.
- Bitcoin open interest can confirm participation or warn of crowded leverage.
- Liquidations show forced trades, not exact tops or bottoms.
- The best framework combines ETF flows, liquidity, leverage, options, on-chain data, and macro events before forming a view.
Frequently Asked Questions
What are bitcoin market indicators?
Bitcoin market indicators are data points that help investors understand market demand, leverage, liquidity, volatility, sentiment, and holder behavior. Examples include ETF flows, funding rates, open interest, liquidations, spot volume, options skew, stable coin liquidity, and on-chain cost-basis data.
Do ETF inflows move Bitcoin price?
ETF inflows can support Bitcoin demand, especially when they are sustained and paired with strong spot volume. But ETF inflows do not guarantee price gains. Price can still weaken if leverage is crowded, macro conditions worsen, or liquidity dries up.
Is negative funding bullish for Bitcoin?
Negative funding can sometimes be bullish if short positions are crowded and price starts moving higher. But it is not automatically bullish. Funding must be read with open interest, price trend, spot demand, and liquidation risk.
Is rising open interest dangerous?
u003cpu003eRising open interest is not always dangerous. It can show growing participation. It becomes more risky when open interest rises quickly while spot demand is weak, funding is extreme, and price is moving on thin liquidity.u003c/pu003e
What causes crypto liquidations?
Crypto liquidations happen when leveraged traders no longer have enough margin to maintain their positions. Long liquidations happen when price falls. Short liquidations happen when price rises. Large liquidation events can accelerate market moves.
What are crypto liquidity indicators?
Crypto liquidity indicators include spot volume, order-book depth, bid-ask spreads, stable coin balances, exchange liquidity, slippage, and derivatives depth. They help show whether the market can absorb large trades without sharp price moves.
Can Bitcoin indicators predict the next price move?
No. Bitcoin indicators can improve market context, but they cannot reliably predict the next price move. They are best used for risk awareness, position sizing, and understanding whether price action is supported or fragile.
Build a Weekly Bitcoin Signal Routine
Do not chase every chart. Build a repeatable routine: check ETF flows, spot liquidity, funding rates, open interest, liquidations, options skew, stable coin liquidity, on-chain cost-basis levels, and the macro calendar once per week. Then label the setup as Positive, Neutral, Cautious, or Insufficient confirmation. The goal is not to predict Bitcoin perfectly. The goal is to avoid making decisions from one noisy signal.
Reviewed by: The Finance Orbit Editorial Team
Reviewed and updated: July 21, 2026
Disclaimer: This article is for general educational and informational purposes only and does not constitute financial, investment, tax, legal, insurance, crypto, or credit advice. Products, rates, laws, limits, eligibility rules, market data, token prices, exchange terms, liquidity, indicators, and regulations can change. Verify current information and consult a qualified professional for advice specific to your circumstances.





 before deciding how much money to put in. ## How to Buy Bitcoin: How It Works Buying Bitcoin usually follows the same basic process in most countries. 1. Choose a crypto exchange, broker, wallet app, or peer-to-peer marketplace. 2. Create an account. 3. Verify your identity if required. 4. Add a payment method. 5. Search for Bitcoin or BTC. 6. Enter the amount you want to buy. 7. Review the price, spread, and fees. 8. Confirm the purchase. 9. Secure your account and decide where to store the BTC. You can buy a fraction of Bitcoin. One Bitcoin is divisible into 100,000,000 satoshis, often called sats. ### Bitcoin purchase formula **Bitcoin received = money spent ÷ Bitcoin price** Example: | Item | Amount | | ------------------------- | ---------: | | Amount spent | $200 | | Bitcoin price | $80,000 | | Estimated BTC before fees | 0.0025 BTC | If the platform charges a $3 fee or uses a wide spread, the actual BTC received will be lower. Always check the final preview screen before confirming. ## How to Buy Bitcoin: Real-World Examples by Country Bitcoin access varies by country. Some countries have regulated exchanges and bank transfers. Others rely more on peer-to-peer trading, local payment apps, or offshore platforms. Rules can also change quickly, so verify current local law before buying. ### How to Buy Bitcoin in the USA U.S. buyers should be especially careful about platform selection because not every global exchange legally serves U.S. customers. A practical U.S. process: 1. Choose a platform that is available to U.S. residents and follows U.S. compliance rules. 2. Verify your identity with a government-issued ID. 3. Link a bank account, debit card, wire transfer, or approved payment method. 4. Search for BTC. 5. Buy a small test amount first. 6. Enable two-factor authentication. 7. Record your purchase price, fee, date, and transaction details. 8. Consider moving long-term holdings to a personal wallet after learning wallet safety. U.S. buyers should also understand taxes. Selling Bitcoin, exchanging it for another crypto asset, using it for purchases, or receiving it as income can create tax-reporting obligations. The IRS says taxpayers must report digital asset transactions on their tax returns. ([Finance Orbit][1]) ### How to Buy Bitcoin in the UAE UAE buyers should check whether the platform is approved or permitted in the relevant emirate and whether local banking support is available. A practical UAE process: 1. Choose a platform that supports UAE users and local payment methods. 2. Verify your identity with an Emirates ID, passport, or required document. 3. Deposit AED if supported, or use an approved payment rail. 4. Buy BTC. 5. Review trading fees, conversion fees, and withdrawal fees. 6. Secure the account with two-factor authentication. 7. Use a personal wallet for larger long-term holdings if you understand private-key safety. Dubai has a more developed virtual-asset regulatory framework than many regions, but users should still verify the current status of any provider before depositing money. ### How to Buy Bitcoin in the UK, Canada, Europe, India, Nigeria, and Other Countries The process is similar globally, but rules and payment options differ. | Region or country | Common buying method | Main thing to check | | ----------------- | ---------------------------------------------- | ------------------------------------------------ | | United States | U.S.-available exchange or broker | Tax records, state access, platform registration | | United Kingdom | FCA-compliant or locally available platform | Crypto promotion rules and bank restrictions | | Canada | Canadian-supported exchange | Provincial rules, tax reporting, deposit limits | | European Union | EU-available exchange | MiCA-related provider status and local tax rules | | UAE | Locally supported exchange or broker | Emirate-level rules and banking support | | India | Exchange or approved local method | Tax rules, TDS, banking access | | Nigeria | P2P, local exchange, or approved payment route | Banking rules, fraud risk, spreads | | Pakistan | P2P or offshore platform where available | Legal uncertainty and payment risk | | Brazil | Local or global exchange | Tax reporting and local payment fees | | Philippines | Local or global exchange | Platform registration and wallet security | This table is only a starting point. Always verify current rules in your jurisdiction before buying. ## How to Buy Bitcoin Around the World If you are buying Bitcoin outside the United States, focus less on global brand names and more on local availability, legal status, payment rails, and withdrawal access. Ask these questions before using any platform: * Does the platform legally serve my country? * Can I deposit and withdraw in my local currency? * Are bank transfers cheaper than card purchases? * Does the platform let me withdraw Bitcoin to my own wallet? * What is the spread between buy and sell prices? * Are there withdrawal fees or network fees? * Is customer support available in my language? * Does the platform require identity verification? * What happens if my bank blocks the transfer? * Are there local tax-reporting rules? If a platform is not clear about fees, withdrawals, ownership, or legal availability, do not rush. ## Best Platforms for People Learning How to Buy Bitcoin There is no single best Bitcoin platform for every country. A good beginner platform should be easy to use, transparent about fees, and clear about whether you are buying real Bitcoin or only trading Bitcoin price exposure. ### Crypto exchanges Crypto exchanges let users buy, sell, and sometimes withdraw Bitcoin. A good beginner exchange should have: * Clear country availability * Strong account security * Transparent fees and spreads * Bank transfer support where possible * Bitcoin withdrawals * Proof of identity process * Clear tax documents where available * Reasonable customer support * No promises of guaranteed returns For platform-selection details, review [best crypto exchange for beginners](https://thefinanceorbit.com/best-crypto-exchange-for-beginners-in-2026/) before choosing where to open an account. ### Crypto brokers and fintech apps Some brokers and fintech apps make Bitcoin buying simple, but they may charge higher spreads or limit withdrawals. Check whether you can: * Withdraw real Bitcoin * Transfer to an external wallet * View fees before buying * Use limit orders * Download tax documents * Access customer support If the platform does not allow Bitcoin withdrawals, you may only have price exposure inside that app. ### Bitcoin ATMs Bitcoin ATMs can be convenient, but they often charge high fees and wide spreads. They may also require identity verification depending on location and amount. Use extra caution with Bitcoin ATMs if someone is pressuring you to deposit cash, pay a bill, send money to a stranger, or “protect” funds from a fake government or bank warning. Those are common scam patterns. ### Peer-to-peer marketplaces Peer-to-peer buying means buying Bitcoin directly from another person through a marketplace or local payment method. P2P can help in countries with limited banking access, but it adds counterparty risk. Use P2P only if: * The platform has escrow protection. * The seller has strong history. * You understand payment reversal risk. * You avoid off-platform deals. * You never release payment before receiving Bitcoin. * You keep chat and payment records. * You start with a small test transaction. ## Spot Bitcoin vs Bitcoin CFDs and Derivatives Beginners should understand the difference between buying real Bitcoin and trading Bitcoin price exposure. | Product | Do you own BTC? | Best for | Main risk | | ----------------- | --------------------------------- | ------------------------------------------ | ------------------------------------- | | Spot Bitcoin | Yes, if withdrawals are supported | Long-term holding, transfers, self-custody | Price volatility, custody risk | | Bitcoin ETF | No direct BTC ownership | Brokerage-based exposure | Market risk, fund fees, trading hours | | Bitcoin CFD | No | Short-term price trading where legal | Leverage, losses, broker risk | | Bitcoin futures | No physical wallet ownership | Advanced trading and hedging | Leverage, margin calls, complexity | | Crypto perpetuals | No direct spot ownership | Advanced crypto traders | Liquidation risk, funding rates | If your goal is to own Bitcoin, buy spot BTC on a platform that allows withdrawal to a Bitcoin wallet. If you are using ETFs, CFDs, futures, or perpetuals, you are getting price exposure, not the same thing as holding Bitcoin in a wallet. ## Key Benefits of Buying Bitcoin in 2026 ### 1. You can start with a small amount You do not need to buy a full Bitcoin. Many platforms allow small purchases, sometimes starting around $1 to $10 depending on the country and payment method. Start small while learning. A small test purchase can teach you how fees, order previews, wallet addresses, and withdrawals work without risking too much. ### 2. Bitcoin trades 24/7 Bitcoin trades on global crypto markets around the clock. That flexibility can help users in different time zones, but it also means the price can move sharply overnight, on weekends, or during holidays. Do not assume you can ignore risk because the market is always open. ### 3. It can be held personally If you withdraw Bitcoin to a personal wallet, you can hold it without relying on an exchange balance. That is a major feature of Bitcoin, but it also creates responsibility. If you lose your private keys or recovery phrase, no bank can reset the account for you. ### 4. It can support cross-border transfers Bitcoin can be sent globally, but that does not always mean it is the cheapest or best remittance tool. Network fees, exchange fees, local currency conversion, tax rules, and receiver access all matter. ### 5. It can fit a long-term portfolio for some investors Some investors use Bitcoin as a small high-risk allocation alongside stocks, bonds, cash, real estate, and retirement accounts. If you are deciding between Bitcoin and more traditional investments, compare it with your broader plan. For long-term portfolio math, an [investment return calculator](https://thefinanceorbit.com/investment-return-calculator/) can help you test different assumptions. ## How Much Bitcoin Should a Beginner Buy? A beginner should start with an amount small enough that a major price drop would not damage essential finances. A practical starting framework: | Situation | Possible first purchase | | ----------------------------------------- | -------------------------: | | Just learning how the platform works | $10–$25 | | Comfortable testing small market exposure | $50–$100 | | Building a long-term position slowly | 1%–5% of investable assets | | No emergency fund or high-interest debt | Consider waiting | Do not buy Bitcoin with rent money, emergency savings, tuition money, tax money, or borrowed money. Before buying Bitcoin, consider whether you have: * Paid essential bills * Built at least a small cash cushion * Avoided high-interest debt * Understood the risk of total loss * Chosen a secure platform * Created a plan for taxes and records If you are still building financial basics, this [emergency fund vs investing](https://thefinanceorbit.com/emergency-fund-vs-investing/) guide can help you decide whether to save cash before buying risk assets. ## Bitcoin Fees Beginners Should Know The price shown on a Bitcoin chart is not always the full cost of buying. Watch for: | Fee or cost | What it means | | ------------------------- | -------------------------------------------- | | Trading fee | Fee charged to buy or sell | | Spread | Difference between quoted buy and sell price | | Deposit fee | Cost to add money | | Card fee | Extra fee for debit or credit card purchases | | Withdrawal fee | Fee to send Bitcoin off the platform | | Network fee | Blockchain transaction cost | | Currency conversion fee | Cost to convert local currency | | Inactivity or account fee | Platform-specific fee that may apply | Bank transfers are often cheaper than card purchases, but they may take longer. Card purchases are faster but often more expensive. Always review the final amount of BTC you will receive before confirming. ## How to Store Bitcoin After Buying After buying Bitcoin, you have two main choices: keep it on the platform or move it to a personal wallet. ### Keeping Bitcoin on an exchange This may be easier for small balances and beginners, but it creates platform risk. Pros: * Simple * Easy to sell * Password recovery may be available * No wallet setup required * Tax documents may be easier Cons: * Exchange can freeze withdrawals * Platform can be hacked * Account can be compromised * You do not control private keys * Withdrawal rules can change ### Moving Bitcoin to a personal wallet A personal wallet gives you more control, but also more responsibility. Pros: * You control the private keys * Less platform custody risk * Useful for long-term holding * Can receive and send directly Cons: * Losing the recovery phrase can mean permanent loss * Sending to the wrong address can be irreversible * Hardware wallet setup requires care * Scams and fake wallet apps are common A common beginner approach is to keep a small learning amount on an exchange and use a hardware wallet or secure self-custody setup only after understanding wallet safety. ## How to Buy Bitcoin Safely: Step-by-Step Guide ### Step 1: Check your local rules Before signing up, confirm Bitcoin buying is allowed in your country or state and whether there are tax-reporting rules. ### Step 2: Choose a reputable platform Look for legal availability, clear fees, security controls, withdrawal support, customer support, and transparent terms. ### Step 3: Create the account Use a unique email address and a strong password. Do not reuse a password from another site. ### Step 4: Complete identity verification Many regulated platforms require identity verification. This may include a passport, driver’s license, national ID, selfie check, proof of address, or tax information. ### Step 5: Add a payment method Compare bank transfer, debit card, wire transfer, local payment app, and P2P options. Choose the method that balances cost, speed, and safety. ### Step 6: Buy a small test amount Start with a small amount. Confirm you understand the order preview, fee, spread, and final BTC amount. ### Step 7: Enable two-factor authentication Use an authenticator app or security key where possible. Avoid relying only on SMS if stronger options are available. ### Step 8: Decide on storage For small amounts, platform custody may be enough while learning. For larger long-term holdings, research hardware wallets and recovery phrase security. ### Step 9: Keep records Save purchase date, amount spent, BTC received, fee, platform, wallet address, and transaction ID. Records matter for taxes and security. ### Step 10: Build a long-term plan Decide whether you are buying once, buying monthly, trading, or holding. A [dollar-cost averaging](https://thefinanceorbit.com/dollar-cost-averaging/) plan can reduce timing pressure if you are building exposure gradually. ## Common Bitcoin Scams to Avoid Bitcoin scams target beginners because crypto transactions are difficult or impossible to reverse. Avoid: * Guaranteed return platforms * Fake exchange apps * Fake wallet apps * “Double your Bitcoin” promotions * Romance scams * Fake government or bank calls * Bitcoin ATM payment scams * Recovery phrase requests * Fake customer support accounts * Influencer pump groups * Cloud mining guarantees * “Send crypto to unlock withdrawals” scams * Fake investment managers No legitimate exchange, wallet company, government agency, or support agent should ask for your recovery phrase. For a deeper fraud checklist, read [how to avoid Bitcoin scams](https://thefinanceorbit.com/how-to-avoid-bitcoin-scams/) before sending Bitcoin to anyone. ## Bitcoin Taxes and Records Bitcoin taxes depend on your country. In the United States, Bitcoin is generally treated as property for federal tax purposes. That means tax consequences may arise when you sell, exchange, spend, or otherwise dispose of BTC. Keep records of: * Purchase date * Purchase amount * Fee * BTC received * Wallet address * Exchange or broker * Sale date * Sale amount * Cost basis * Gains or losses * Transfers between your own wallets A transfer from one wallet you control to another wallet you control is usually different from selling Bitcoin, but fees and records still matter. If you trade often, use multiple exchanges, receive rewards, or use Bitcoin for payments, tax reporting can become complicated. Consider using crypto tax software or a qualified tax professional. ## Bitcoin vs Ethereum for First-Time Buyers Many beginners ask whether they should buy Bitcoin or Ethereum first. Bitcoin is often viewed as the original crypto asset and a scarce digital store-of-value-style asset. Ethereum is a programmable blockchain used for smart contracts, DeFi, NFTs, stablecoins, and decentralized applications. | Feature | Bitcoin | Ethereum | | -------------------- | --------------------------------------------- | ----------------------------------------- | | Main role | Digital asset and decentralized money network | Smart contract platform | | Native asset | BTC | ETH | | Supply model | Fixed maximum supply by protocol | Different issuance and burn mechanics | | Main beginner appeal | Simplicity and brand recognition | Utility across apps and DeFi | | Main risk | Volatility and custody risk | Volatility, smart contract ecosystem risk | Neither is risk-free. If you want the full comparison, review [Bitcoin vs Ethereum](https://thefinanceorbit.com/bitcoin-vs-ethereum/) before buying both. ## Should You Buy Bitcoin All at Once or Over Time? Some buyers invest a lump sum. Others use dollar-cost averaging. A lump sum can work if you already have cash set aside, understand volatility, and will not panic if the price drops. Dollar-cost averaging means buying a fixed dollar amount on a schedule, such as weekly or monthly. It may help beginners avoid the pressure of choosing the perfect price. Example: | Monthly buy | 12-month total | | ----------- | -------------: | | $25 | $300 | | $50 | $600 | | $100 | $1,200 | | $250 | $3,000 | DCA does not guarantee profit or protect against losses. It simply spreads entry points over time. ## Common Mistakes Beginners Should Avoid ### Using a platform that does not serve your country Do not assume a global exchange is available everywhere. If a platform does not legally serve your region, account access and withdrawals can become difficult. ### Buying before checking all fees A low trading fee can be offset by a high spread, card fee, withdrawal fee, or currency conversion fee. ### Leaving security until later Enable two-factor authentication before buying. A hacked account can be expensive. ### Sending Bitcoin to the wrong address Bitcoin transactions are irreversible. Always test with a small transfer before moving a larger amount. ### Using leverage as a beginner Leverage can liquidate your position quickly. Beginners should learn spot buying before using futures, CFDs, margin, or perpetuals. ### Treating Bitcoin like guaranteed income Bitcoin has no guaranteed return. Avoid platforms or influencers promising fixed profits. ### Ignoring taxes Tax records are much easier to keep from the beginning than to rebuild years later. ## Quick Summary * The safest way to buy Bitcoin is to use a reputable platform, verify identity, start small, check fees, and secure the account. * You do not need to buy a whole Bitcoin because BTC is divisible into satoshis. * U.S. buyers should keep tax records because Bitcoin sales, trades, and payments may create tax-reporting obligations. * Spot Bitcoin ownership is different from ETFs, CFDs, futures, and other price-exposure products. * Platform custody is convenient, but personal wallets give more control and more responsibility. * Beginners should avoid leverage, fake exchanges, guaranteed-return schemes, and social media hype. * A small test purchase and a clear storage plan are better than rushing into a large buy. ## Frequently Asked Questions ### How do I buy Bitcoin for the first time? Choose a reputable platform available in your country, create an account, verify your identity, add a payment method, search for BTC, enter a small amount, review the fees, and confirm the purchase. After buying, enable two-factor authentication and decide whether to keep the BTC on the platform or move it to a personal wallet. ### Can I buy Bitcoin with $10? Yes, many platforms allow small Bitcoin purchases. You do not need to buy a full Bitcoin because BTC is divisible into small units called satoshis. The exact minimum depends on the platform and payment method. ### What is the safest way to buy Bitcoin? The safest beginner method is to use a reputable, legally available platform, avoid leverage, enable strong two-factor authentication, start with a small purchase, and keep careful records. For larger long-term holdings, learn self-custody before transferring Bitcoin to a personal wallet. ### Is Bitcoin legal to buy worldwide? Bitcoin is legal or accessible in many countries, but rules vary and can change. Some countries restrict trading, banking access, exchanges, mining, or payments. Always check current local laws and tax rules before buying. ### Do I need a wallet to buy Bitcoin? You do not need a personal wallet for the first purchase if you buy through an exchange or broker. However, if you want full control of your Bitcoin, you need a wallet that lets you hold your own private keys. Learn wallet safety before transferring large amounts. ### Is buying Bitcoin the same as buying a Bitcoin ETF? No. Buying spot Bitcoin gives you BTC exposure directly, especially if you can withdraw it to a wallet. Buying a Bitcoin ETF gives you regulated brokerage exposure to Bitcoin price movements through a fund, not direct wallet ownership of BTC. ### Can I lose money buying Bitcoin? Yes. Bitcoin can lose value quickly, and you can also lose money through scams, fees, hacks, wrong wallet addresses, leverage, or tax mistakes. Only buy what you can afford to risk. ## Start With One Safe Bitcoin Purchase Plan Do not rush into Bitcoin because of a price headline or social media post. Choose a legitimate platform, buy a small test amount, enable two-factor authentication, record the transaction, and learn how withdrawals work before increasing your exposure. The goal is not to buy Bitcoin as fast as possible. The goal is to buy it safely, understand the risks, and avoid beginner mistakes that are hard to reverse. Reviewed by: The Finance Orbit Editorial Team Reviewed and updated: July 22, 2026 Disclaimer: This article is for general educational and informational purposes only and does not constitute financial, investment, tax, legal, insurance, crypto, or credit advice. Products, rates, laws, limits, eligibility rules, platform availability, fees, token prices, tax treatment, wallet features, exchange terms, and regulations can change. Verify current information and consult a qualified professional for advice specific to your circumstances. [1]: https://thefinanceorbit.com/how-to-buy-bitcoin-worldwide/ "How to Buy Bitcoin Worldwide in 2026: Complete Beginner's Guide"](https://thefinanceorbit.com/wp-content/uploads/2026/05/how-to-buy-bitcoin-worldwide-2026.webp-768x432.jpg "How to Buy Bitcoin in 2026: Safe Beginner’s Guide 12")